
“Data are not generic. They are created.” — boyd, danah and Crawford, Kate (2012), Critical Questions for Big Data
How did we do it?
In our project, we adopted a method that combines tradition and modernity, including meticulous manual extraction and assisted analysis with digital tools. This combination enables us to gain a deeper understanding and restore the true face of historical data.
Digital Tools
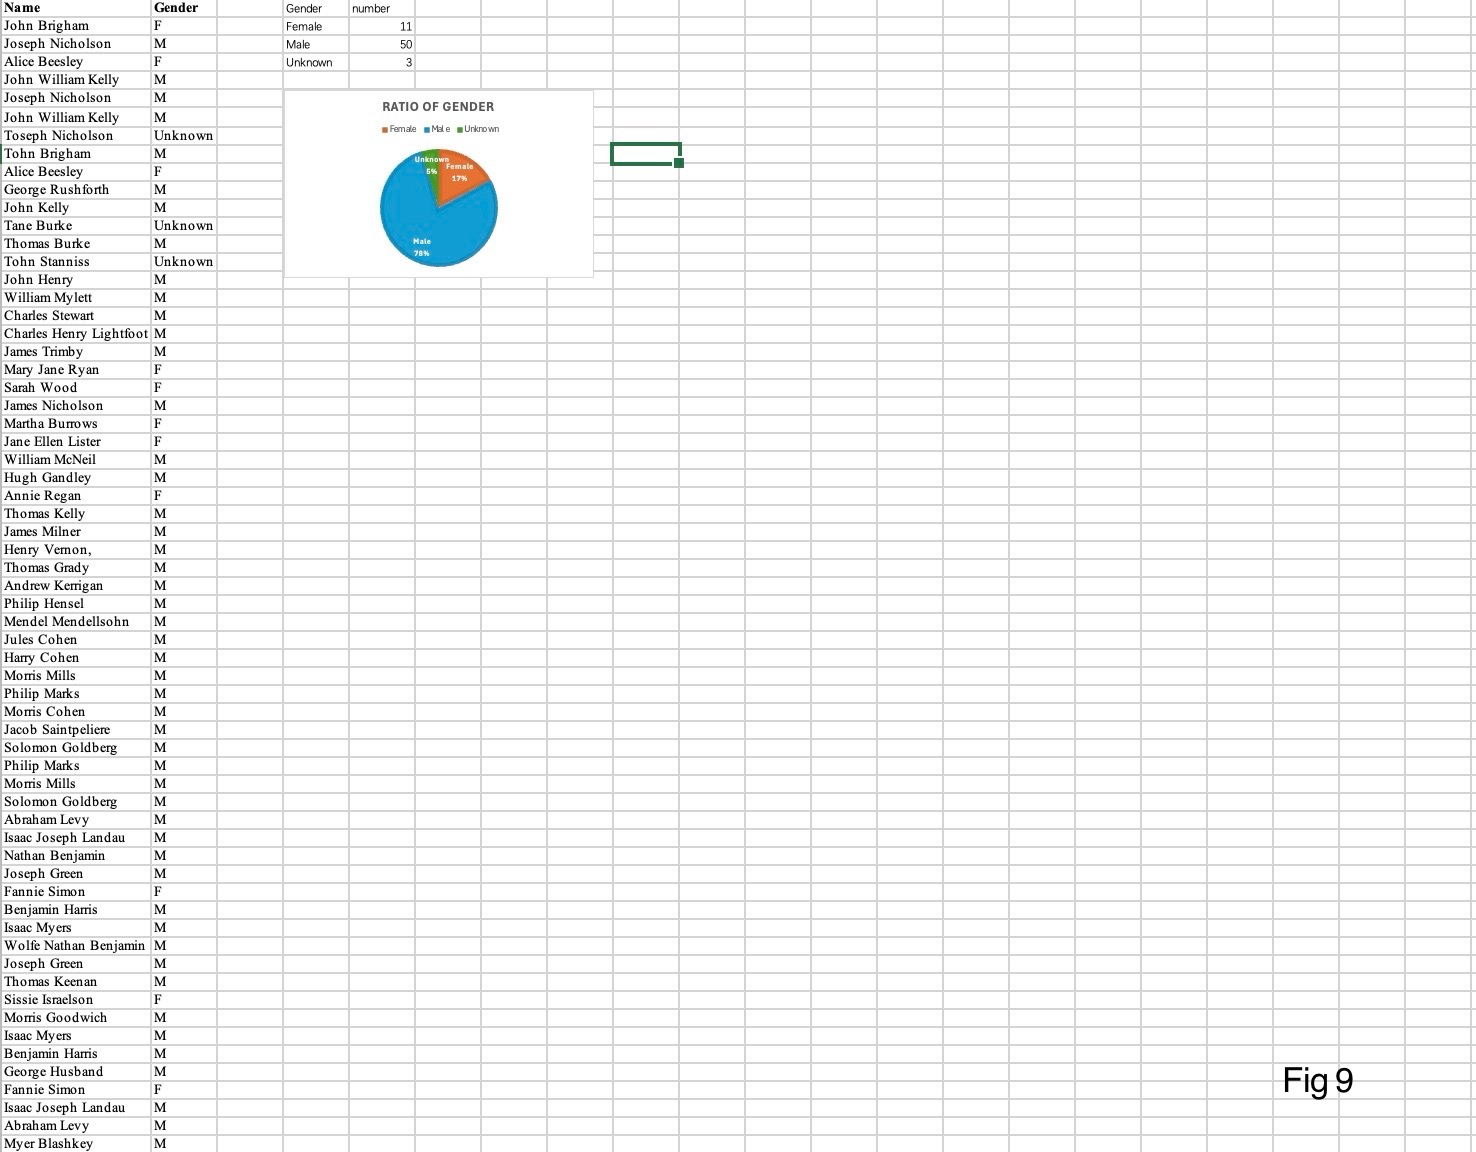
Specifically, we manually extracted relevant data from 「the Housing of the Working Classes Act, 1890 & Quarry Hill Unhealthy Area, 1900 」occupiers' records and used the https://genderize.io tool to infer gender from names. This method helped us identify gaps and omissions in historical records, especially the lack of female contributions.

An Invisible Presence
We adopted a particularly innovative narrative approach - the fictional character "Mary" to represent those women who were ignored in official historical records. We did not provide her with an image, but only made her "appear" through sound. This "audible but invisible" design is a powerful response to the "visual absence" of women in historical archives - her invisibility has become a symbol of presence.
We also reflected on whether we could use AI image generation tools to give "Mary" a more specific visual image to make the narrative more interactive and immersive. But as many feminist data scholars have warned, such tools may inadvertently reinforce stereotyped gender imaginations. Therefore, we chose to keep her "invisibility" not because of technical limitations, but out of ethical restraint and resistance - a profound criticism of visual domination and reproduction mechanisms.
At the same time, we also used some first-hand information in the process of making the video

Seeing the Unseen
Digital media tools have allowed us to revisit historical collections through a radically new lens. Grounded in feminist and anti-patriarchal frameworks, our project interrogates every layer of data processing—from extraction to visualisation—asking: Who gets recorded, and who gets left out?
What we learned?
Through this project, we came to understand that data visualisation is not merely a tool for displaying facts—it is a form of interpretation. At its core, our work engages with historical data through a critical lens, exposing the silences, gaps, and omissions that traditional records have long overlooked.
Digital tools have empowered us to reimagine history, not as a fixed narrative of the past, but as a fluid and evolving process shaped by the ways we read and represent data. By combining manual extraction with modern visualisation techniques, we challenged the structural biases embedded in historical records and experimented with new modes of storytelling that blend fact and imagination.
More than just extracting information, we critically reflected on the tools, methods, and assumptions behind the data. In doing so, we discovered that working with history is not only about looking back—but about actively reshaping how the past is seen, felt, and understood today.